OUR PERFORMANCE:
CIO's Business Review

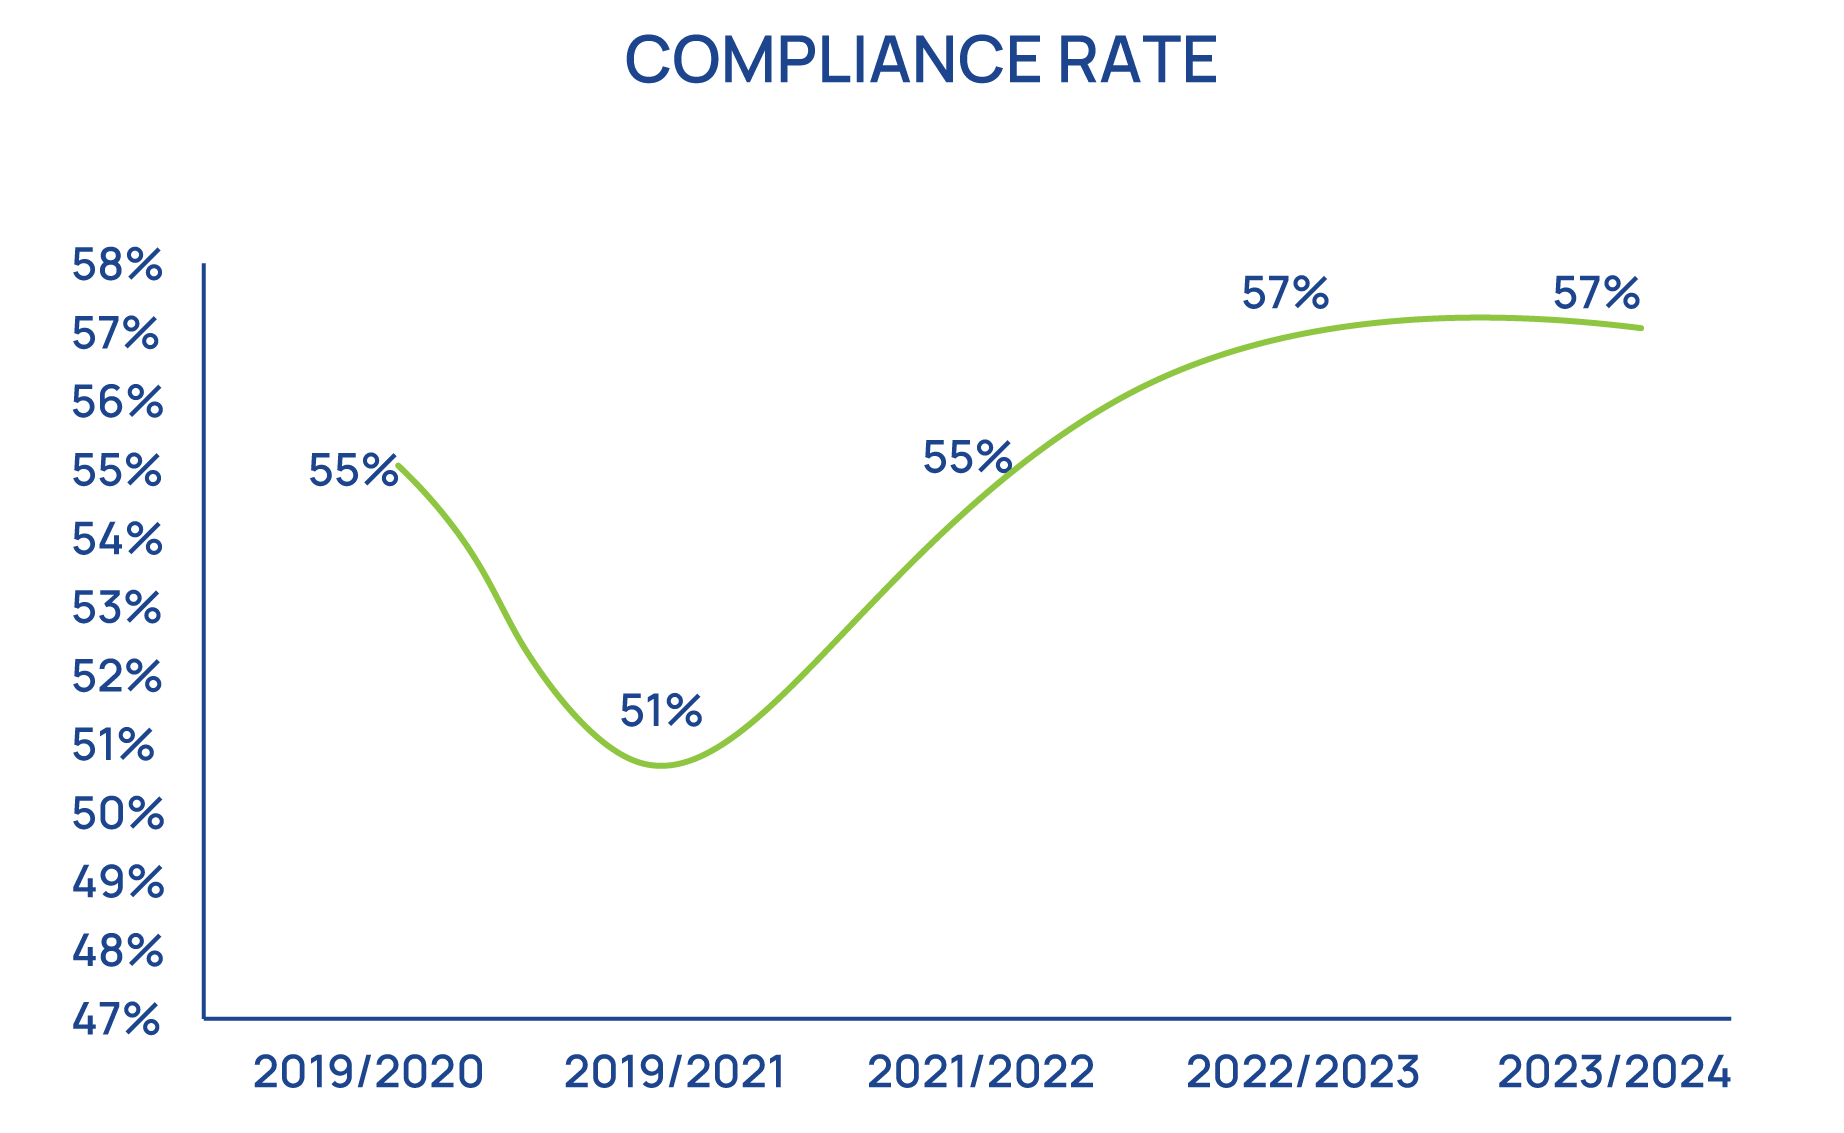
Slow recovery in compliance and collections
The impact of the lockdown to combat the spread of Covid-19 continues to weigh heavily on compliance rates.
As depicted in Figure 4 on the left, compliance rates stagnated to about 57%. Delays in collections or non-compliance, results in the investment programme being adversely affected.
In partnership with the Ministry of Gender, Labour, and Social Development, there is a drive to train and equip labour inspectors to ensure compliance with the existing labour laws.
Figure 4: The Fund’s compliance trend in the last four fiscal years
Source: Internal
Impact of geopolitical tensions and Covid-19 on real estate projects
Global conflicts, high oil prices, fiscal consolidation, anxiety, and volatile markets continued in the fiscal year. Our projects, especially those initiated before the Covid-19 pandemic, continue to feel these effects. Nevertheless, we persist in navigating these challenges, balancing compliance with pragmatic solutions to enhance project progress.

Opportunities
Despite the downside effects and trade-offs, we took advantage of several opportunities:
Diversification opportunities in the regional markets
Diversification of the portfolio continues to be a continuous journey. Markets volatility continued throughout the fiscal year. We, however, cautiously took advantage of the diversification opportunities albeit with the constraint of market liquidity. After two consecutive years of net outflows, the Nairobi Stock Exchange bourse registered a year of net foreign inflows.
This was driven by the improved investor confidence following Kenya's successful issuance of the $1.5 billion Eurobond and settlement of the June 2024 Eurobond. Indeed, the NSE posted the highest returns among African bourses in dollar terms in the first half of 2024 (the period between 2 January 2024, and 30 June 2024) buoyed by a stronger KES and higher blue chip share prices that saw investor wealth at the market rise by KES 291 Bn ($2.26Bn) in the period. In USD terms, the Kenyan equity market achieved a return of 50.4% according to the Morgan Stanley Capital International (MSCI) Index for the six months to June 2024, beating Zimbabwe (34.4%), Mauritius (8.0%) and Morocco (6.8%) which were the other top African performers in the frontier and emerging markets indices.
On the fixed income side, the Central Bank of Kenya maintained its benchmark rate (CBR) at 13%, its highest level since 2012, during its 5 June 2024 meeting, against a backdrop of global economic improvements, ongoing inflationary pressures, and geopolitical uncertainties. In Uganda, CBR was above 10% for most of the fiscal year-closing the year at 10.25%. Therefore, we were able to reinvest funds from maturities and coupons in Kenya and Uganda at attractive yields.
Sustainability of the Fund’s investments, climate change, and impact
Responsible investment is a core component of NSSF's investment approach and aligns with sustainable development goals. Achieving good long-term returns relies on sustainable economic, environmental, and social progress. We focus on identifying investment opportunities that minimise unacceptable risks, with climate change being a significant concern. We prefer companies that support environmentally friendly activities and engage directly with our portfolio companies on material ESG issues to enhance their long-term value. Our approach is tailored to assess and evaluate issues crucial to each company's long-term value creation and preservation. While we may avoid investments in companies for sustainability or ethical reasons, such as tobacco companies, we find value in investing in firms that promote environmentally friendly and sustainable practices.
Many of the blue-chip companies the Fund has invested in not only offer good returns but also support inclusive prosperity. For instance, investments in the financial and telecom sectors, such as MTN Uganda, Airtel Uganda, Safaricom, Vodacom Tanzania, Stanbic Bank, Equity Bank, KCB Bank, Trade Development Bank, CRDB Bank, Bank of Kigali, and NMB Bank, contribute to the growth of small, medium, and micro-enterprises (SMMEs) and entrepreneurship. Inclusivity is a crucial criterion for the Fund’s investments. By supporting these companies, the Fund benefits from fintech innovations that provide financial services to previously unbanked populations, thereby enhancing financial inclusion, particularly in rural areas.
The top five equity holdings, depicted in Table 2 below, represent 49.39% of the equity portfolio and are distinguished by their strong sustainability initiatives, which include themes such as economic empowerment, education, health, energy and the environment, food and agriculture, and social protection. As of 30 June 2024, about 90.15% of the equity portfolio comprises of companies with robust sustainability practices, an increase from 77.50% the previous year.
Table 2: Top equity holdings and sustainability in the portfolio in the year ended 30 June 2024
| 30 June 2024 | 30 June 2023 | |||||
|---|---|---|---|---|---|---|
| Counter | Amount (UGX) | % | Counter | Amount (UGX) | % | |
| 1 | MTN Uganda | 447,033,344,700 | 16.27% | MTN | 336,600,000 | 14.43% |
| 2 | Airtel Uganda | 295,316,000,000 | 10.75% | Tanzania Breweries Limited | 213,391,443 | 9.15% |
| 3 | Equity Bank | 210,517,668,783 | 7.66% | Trade Development Bank | 189,162,568 | 8.11% |
| 4 | Trade Development Bank | 203,877,478,298 | 7.42% | Safaricom Limited | 184,250,266 | 7.90% |
| 5 | Safaricom (K) Ltd | 200,227,350,415 | 7.29% | Equity Bank Holdings Plc | 173,374,834 | 7.43% |
| 6 | Tanzania Breweries | 195,555,532,658 | 7.12% | CRDB Bank | 141,733,471 | 6.08% |
| 7 | Umeme Limited | 179,634,735,700 | 6.54% | Kenya Commercial Bank | 131,674,397 | 5.65% |
| 8 | NMB Bank (NMB TZ) | 171,167,256,000 | 6.23% | NMB Bank | 124,998,120 | 5.36% |
| 9 | Housing Finance Bank | 161,955,254,294 | 5.89% | East African Breweries Limited | 109,633,677 | 4.70% |
| 10 | Kenya Commercial Bank | 154,379,971,914 | 5.62% | Umeme Limited | 89,695,482 | 3.85% |
| 11 | CRDB Bank (CRDB) | 143,704,714,761 | 5.23% | Twiga Cement | 58,330,000 | 2.50% |
| 12 | East African Breweries | 114,103,143,879 | 4.15% | Stanbic Bank Uganda Limited | 54,684,148 | 2.34% |
| Total | 2,477,472,451,402 | 90.15% | Total | 1,807,528,406 | 77.50% | |
Source: Internal
Measurement of impact, sustainability, and non-financial returns
Although quantifying the effects of responsible investment is challenging, the Fund has once again demonstrated leadership and trailblazing efforts, surpassing its peers and other corporations in Uganda—both public and private. To better understand whether its resources are contributing positively to Uganda and the East African region while ensuring financial security for its members, the Fund engaged KPMG to conduct an impact assessment.
KPMG assessed the activities of the Fund including its investment programme for the last 11 years from July 2014 to June 2024. The Fund has invested over UGX 16Tn in the last 10 years to 2024.
The aims of the exercise included assessing whether the Fund's investments and own operations were:

The impact of investments was estimated by applying the Sustainable Investment Framework (SIF) developed by Cambridge University in the United Kingdom and the KPMG True Value Methodology. The SIF aggregates Sustainable Development Goals (SDGs) into six themes: resource security, basic needs, wellbeing, decent work, climate stability, and healthy ecosystems. Meanwhile, the KPMG True Value Methodology monetises social, economic, and environmental impacts using standardised monetisation factors as outlined by international methodologies such as the Value Balancing Alliance.
According to KPMG, the total value created over the period 2014 to 2024 by NSSF is estimated at UGX 143.3Tn. For FY2024, the total true value created amounted to an estimated UGX 32Tn which is 7.3 times more than the total value achieved in FY2014.
KPMG found that by far the largest value-adding component resulted from the financial security provided by NSSF to its members. The average annual interest credited to member accounts accruing from investments since 2014 has been 11.5%. Moreover, the total value of financial security for 2024 was calculated at UGX 15.5Tn (of the UGX 32Tn). KPMG assisted the Fund in quantifying this impact by looking at how the pay-out to members contributed to a high-quality life where basic needs are covered allowing those members to better enjoy their lives.
To express NSSF’s contribution to the Uganda economy, KPMG calculated the value of NSSF’s financial security in economic terms which leads to a lower value compared to applying the international standards for impact measurement based on the quality of life. In economic terms NSSF's payouts contribute to the Ugandan GDP and employment.
The total value created in Uganda alone, amounted to an estimated UGX 59.5Tn over the past 11 years which is equivalent to 28.1% of the country’s expected GDP for 2024, or an average annual contribution of 3.8% of GDP for each of the years from 2014 to 2024.
Over the same period, an estimated total of 1,879,500 (or an annual average of 170,800) Full Time Equivalent (FTE) employment opportunities were created—these are jobs, on average, earning above the average living wage—which for Uganda is about UGX 27m a year—according to Valuing Impact most recently available dataset (2022)— Valuing Impact is a globally recognised organisation recommended by international standards, such as Value Balancing Alliance, as the provider for living wages datasets.
In 2024 alone, 310,000 FTEs employment were supported by NSSF activities in line with the NDPIII goal to generate approximately 558,000 jobs a year.

A part of this value originates from the NSSF investing in government bonds, which assist in providing funds to the Government of Uganda to make investments into the economy through the provision of public goods and services including administration, safety and security, education, health services and infrastructure development. The contribution includes not only government’s direct expenditure on public goods and services, but also the secondary impacts of this expenditure throughout the value chains within the Ugandan economy. The result is that for each shilling invested in Uganda in 2024, the total true value created is 2.0 times larger.
The positive impact resulting from NSSF’s equity investments in Uganda is UGX 6.5Tn over the past 11 years to 2024, with UGX 2.6Tn generated in 2024.
The final asset class invested in by NSSF is real estate. This portfolio is growing over time. The NSSF is continually adding to the portfolio and has already started or completed developing projects across Uganda including locations in Kampala, Mbale, Wakiso, Mbarara, and Jinja. To this end KPMG calculated the value of the active real estate investments as opposed to vacant land. The results show that for each shilling invested in real estate in 2024, the estimated true value is 1.7 times larger.
The true value calculated for NSSF’s own operations is far broader than their financial results and amounts to UGX 16.1Tn over the period from 2014 to 2024, where UGX 3.9Tn was generated in 2024.

A NEW DAY - CREATING SHARED VALUE FOR SUSTAINABLE GROWTH