OUR BUSINESS:
Five year performance review

Income statement
| Five Year Performance Review | Actual 19/20 Ushs. Billion | Actual 20/21 Ushs. Billion | Actual 21/22 Ushs. Billion | Actual 22/23 Ushs. Billion | Actual 23/24 Ushs. Billion | Budget 23/24 Ushs. Billion | Actual 23/24 vs Actual 22/23 Var % | Actual 23/24 vs Budget 23/24 Var % | CAGR (19/20-23/24) |
|---|---|---|---|---|---|---|---|---|---|
| Total Income | 1,471 | 1,837 | 1,776 | 1,158 | 3,180 | 2,349 | 175% | 35% | 21% |
| Total Revenue(Core) | 1,472 | 1,696 | 1,912 | 2,201 | 2,529 | 2,349 | 15% | 8% | 14% |
| Total Cost* | 158 | 164 | 203 | 191 | 222 | 228 | 16% | -3% | 9% |
| Profit Before Interest & Tax | 1,312 | 1,672 | 1,573 | 968 | 2,958 | 2,121 | 206% | 39% | 23% |
| Profit After Tax | 1,160 | 1,505 | 1,393 | 774 | 2,742 | 1,908 | 254% | 44% | 24% |
Total Costs (Operating Expenditure)* Operating expenses represent costs incurred to support income generation for the Fund. Major categories include staff costs, equipment costs, costs associated with Fund Premises and other costs. These have grown at a CAGR of 9% over the past 5 years in line with the fund's initiatives expected to deliver the target values and activities.
Financial position (UGX' Bn)
| Five Year Performance Review | Actual 19/20 Ushs. Billion | Actual 20/21 Ushs. Billion | Actual 21/22 Ushs. Billion | Actual 22/23 Ushs. Billion | Actual 23/24 Ushs. Billion | Budget 23/24 Ushs. Billion | Actual 23/24 vs Actual 22/23 Var % | Actual 23/24 vs Budget 23/24 Var % | CAGR (19/20-23/24) |
|---|---|---|---|---|---|---|---|---|---|
| Total Assets | 13,284 | 15,559 | 17,255 | 18,560 | 22,133 | 21,095 | 19% | 5% | 14% |
| Fixed Income Investments | 10,235 | 11,773 | 13,061 | 14,340 | 17,293 | 16,332 | 21% | 6% | 14% |
| Equity Investments | 1,912 | 2,378 | 2,607 | 2,370 | 2,924 | 2,878 | 23% | 2% | 11% |
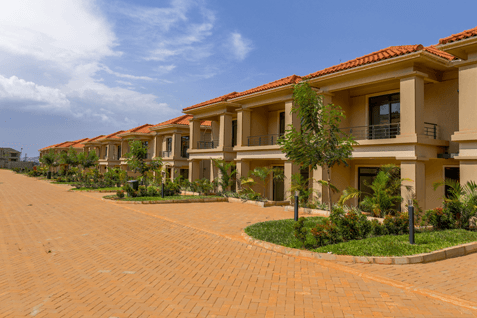
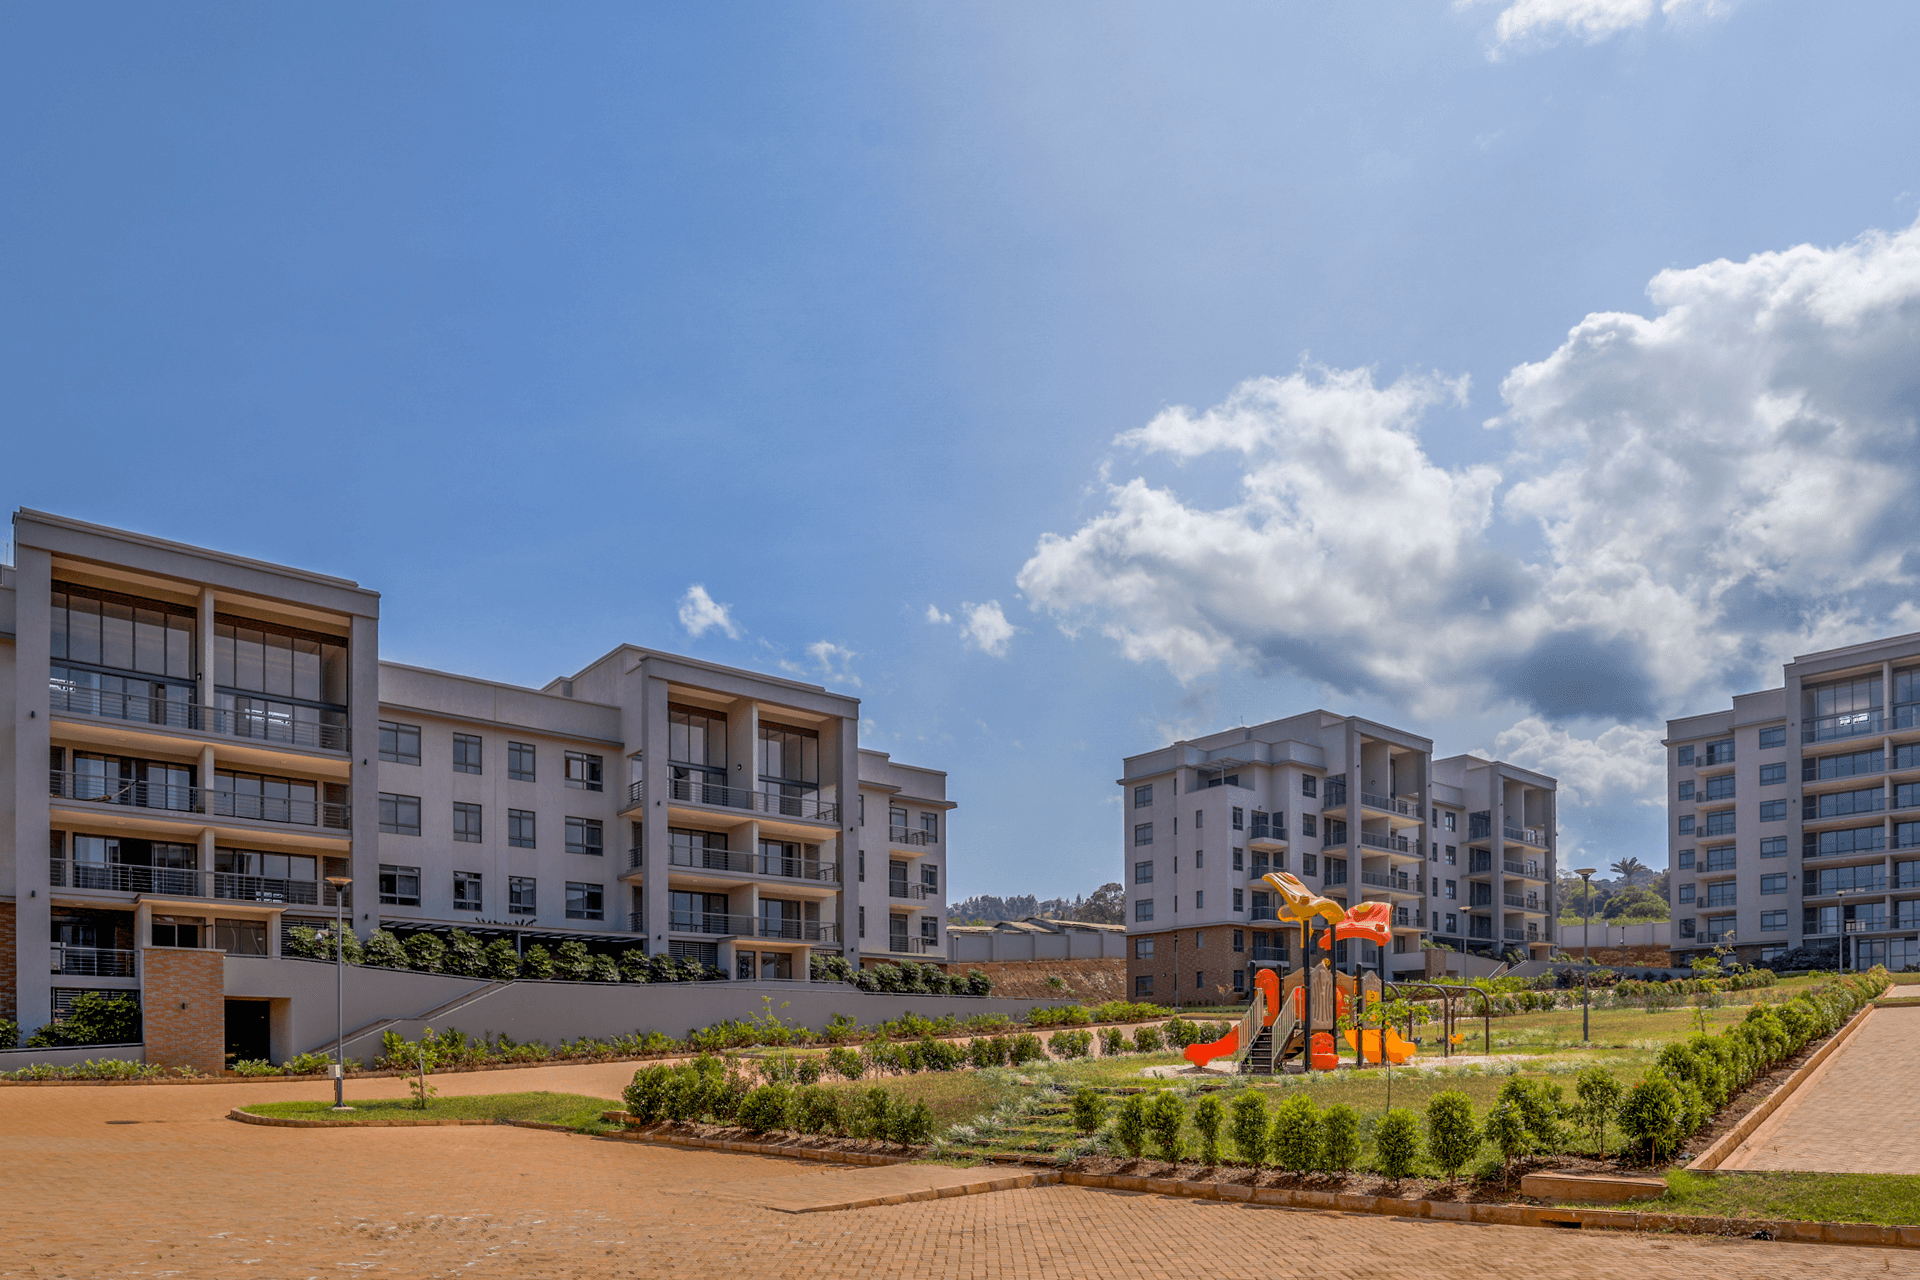
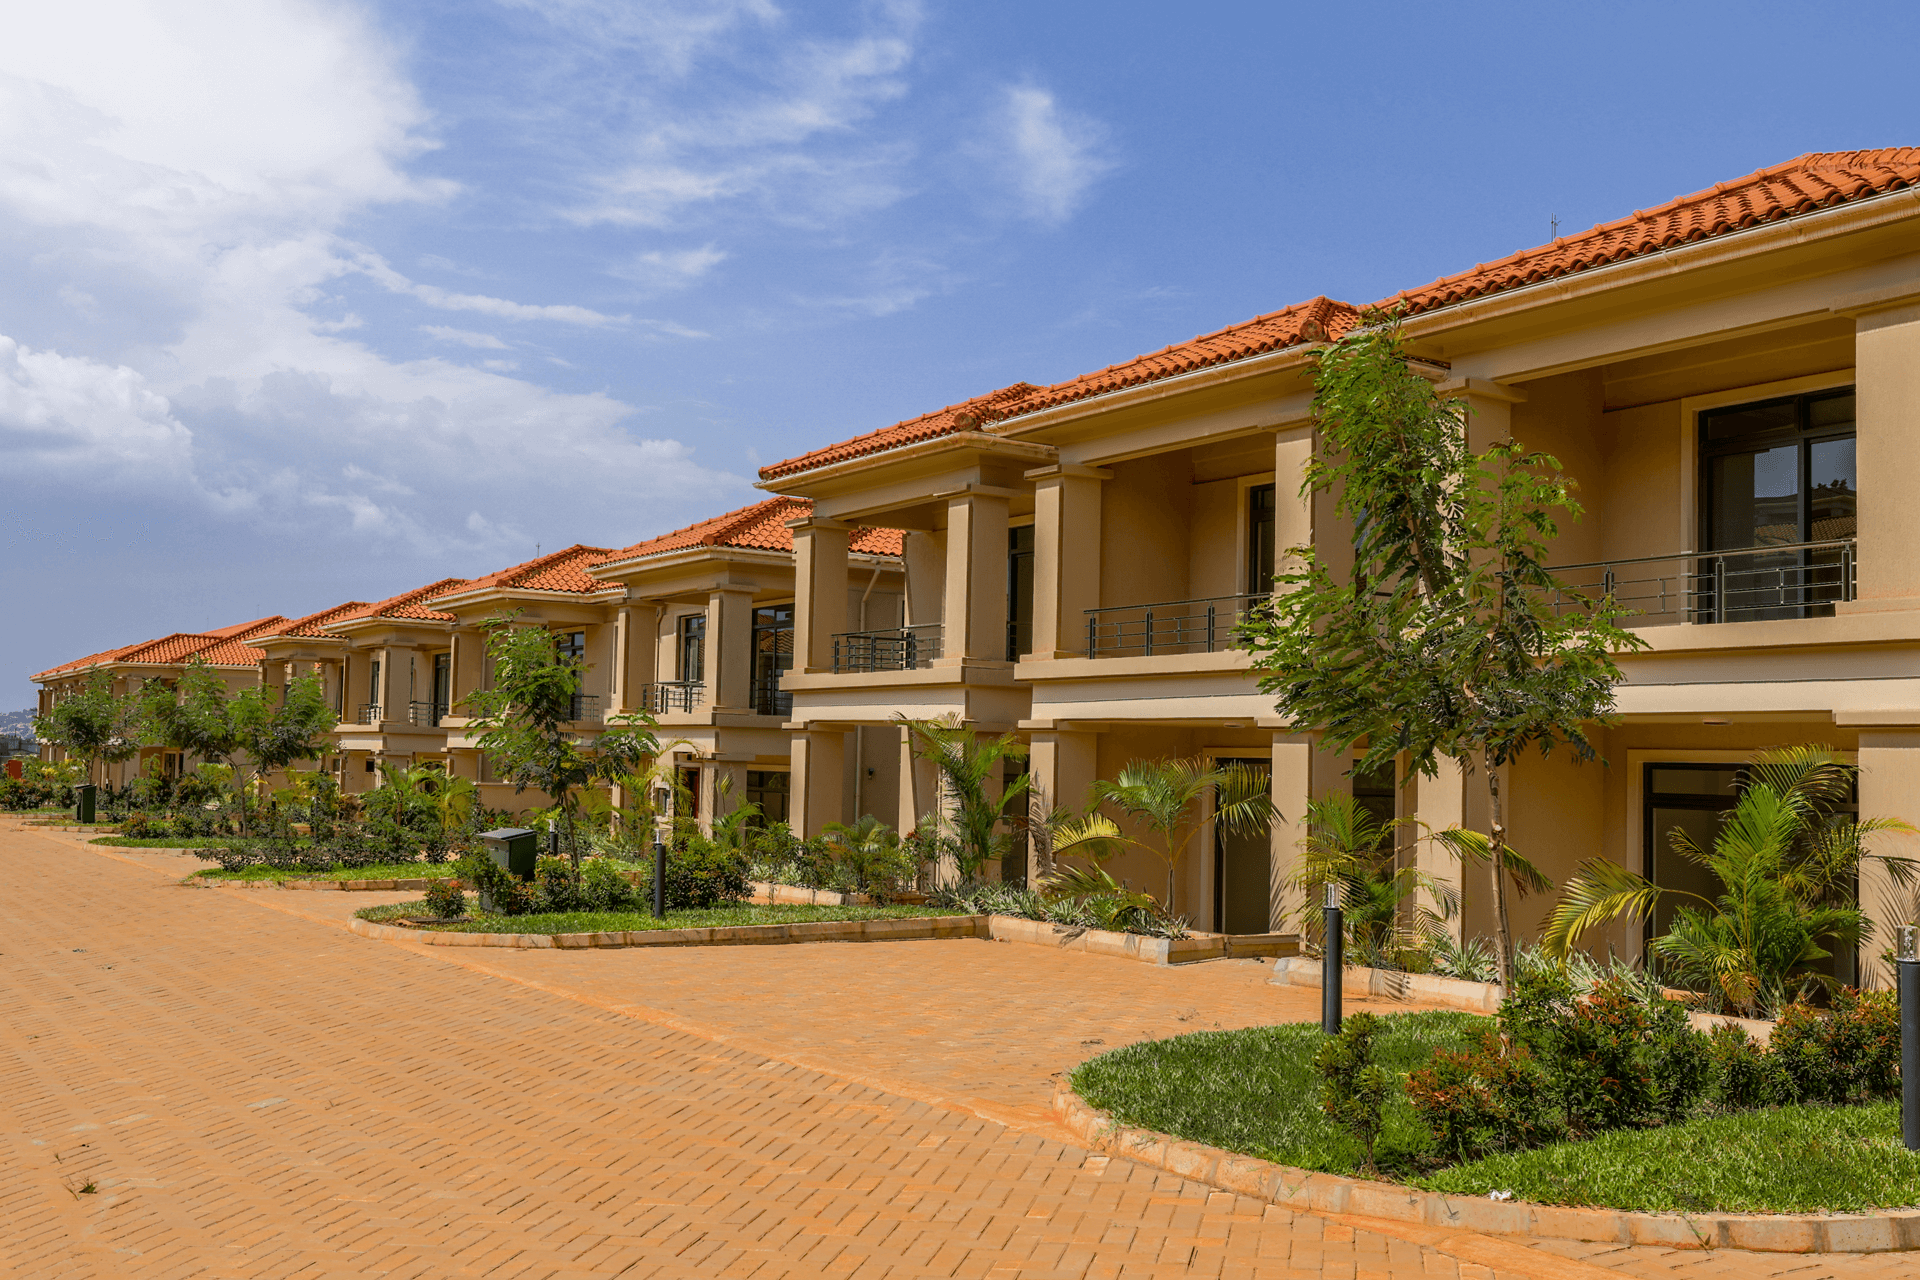
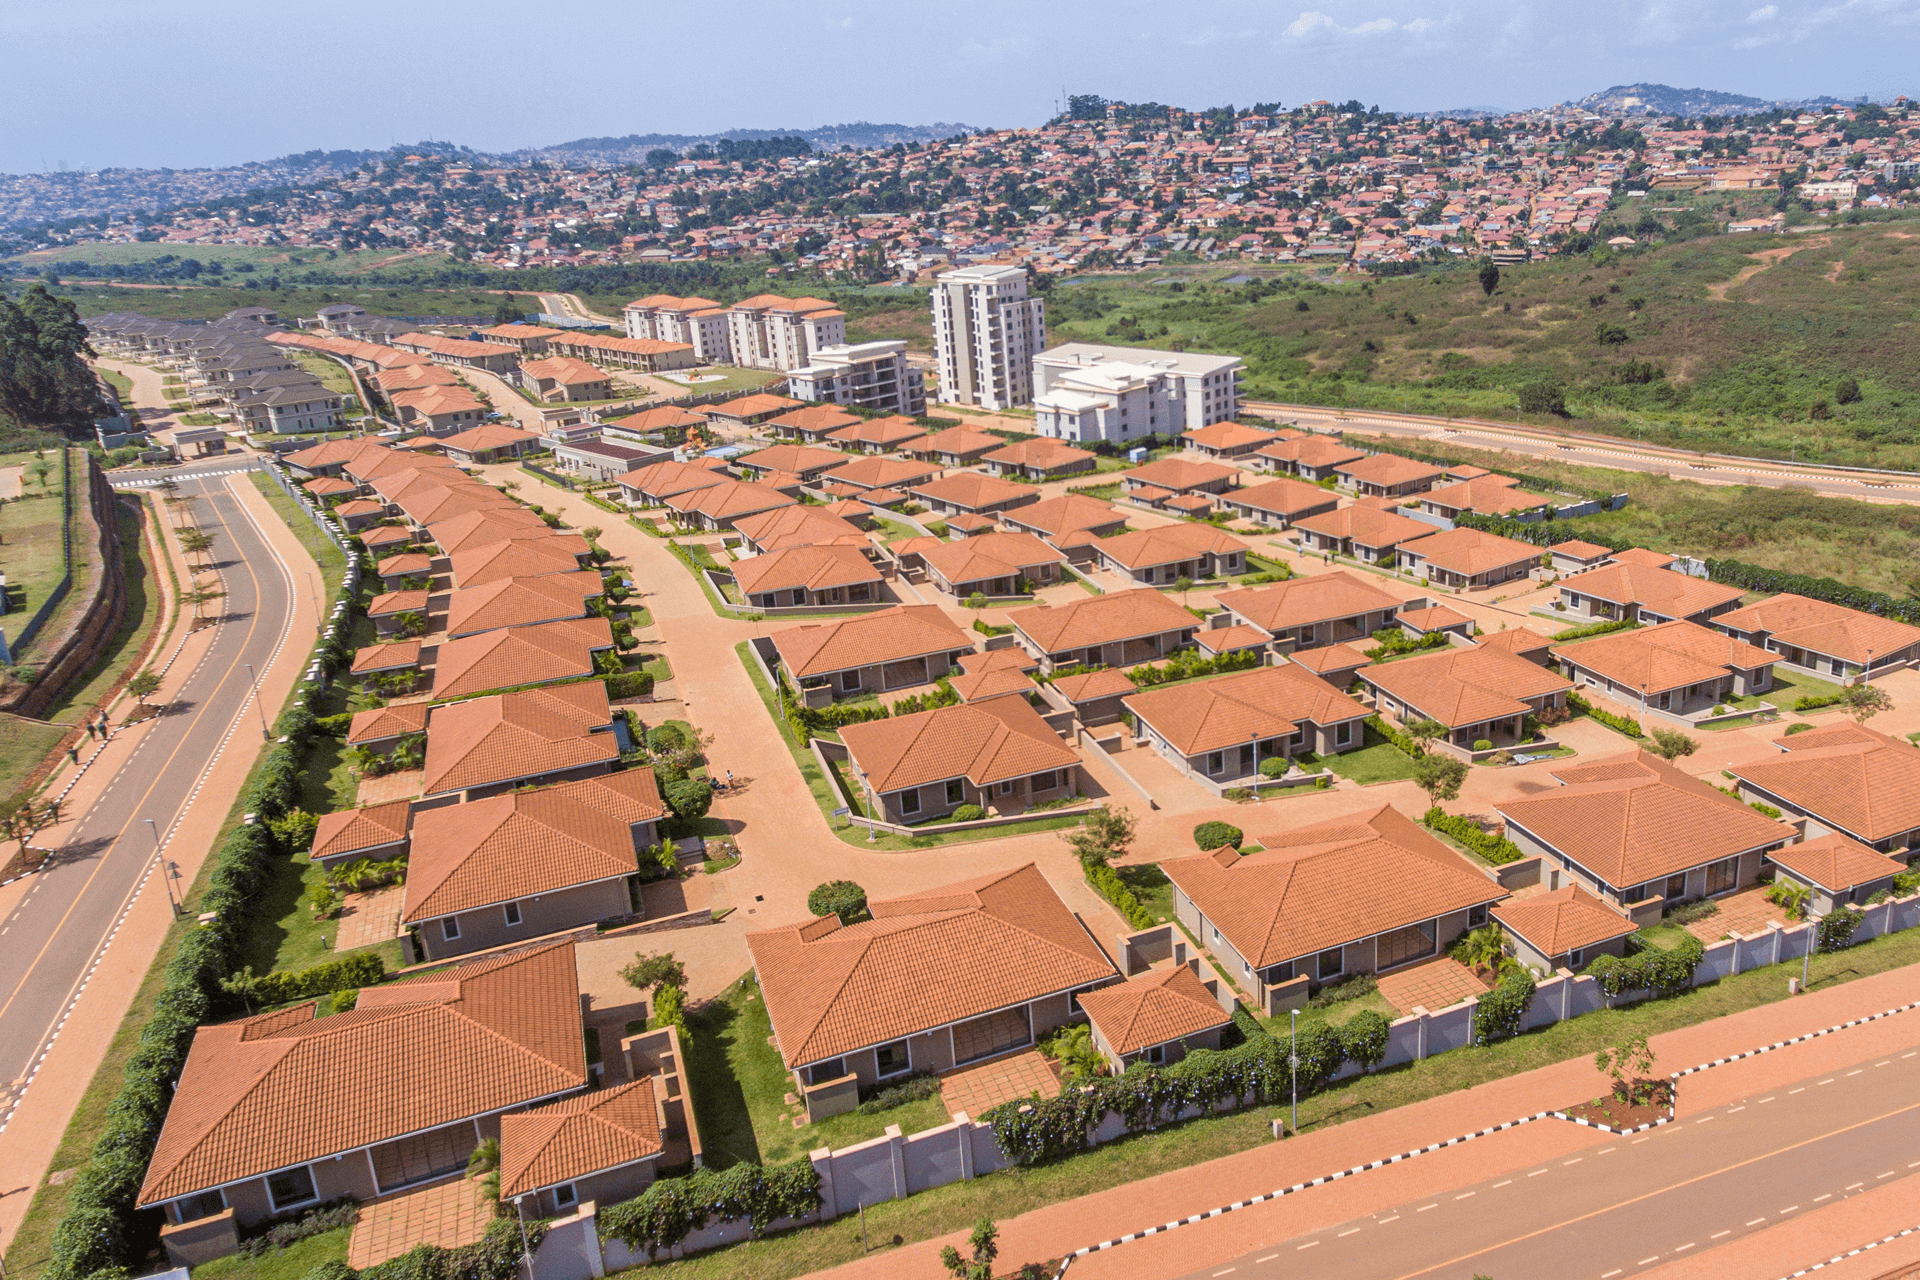
| Real Estate | 943 | 1,142 | 1,173 | 1,303 | 1,536 | 1,691 | 10% | -15% | 11% |
| Total Investments | 13,090 | 15,292 | 16,842 | 18,013 | 21,752 | 20,901 | 20% | 4% | 13% |
| Accumulated Members' Funds | 13,062 | 15,299 | 16,962 | 19,068 | 21,950 | 20,790 | 15% | 6% | 14% |
Financial performance (%)
| Five Year Performance Review | Actual 19/20 Ushs. Billion | Actual 20/21 Ushs. Billion | Actual 21/22 Ushs. Billion | Actual 22/23 Ushs. Billion | Actual 23/24 Ushs. Billion | Budget 23/24 Ushs. Billion | Actual 23/24 vs Actual 22/23 Var % | Actual 23/24 vs Budget 23/24 Var % | CAGR (19/20-23/24) |
|---|---|---|---|---|---|---|---|---|---|
| Realised Return on Average Investment (%) | 12.1% | 11.9% | 11.9% | 12.6% | 12.7% | 11.2% | 1% | 13% | N/A |
| Cost Income Ratio (%) | 10.77% | 8.95% | 11.44% | 16.45% | 6.97% | 9.69% | 58% | 28% | N/A |
| Cost of Administration (%) | 1.19% | 1.06% | 1.18% | 1.03% | 1.00% | 1.08% | 2% | 7% | N/A |
Member's fund statistics (UGX 'M)
| Five Year Performance Review | Actual 19/20 | Actual 20/21 | Actual 21/22 | Actual 22/23 | Actual 23/24 | Budget 23/24 | Actual 23/24 vs Actual 22/23 Var % | Actual 23/24 vs Budget 23/24 Var % | CAGR (19/20-23/24) |
|---|---|---|---|---|---|---|---|---|---|
| Contributions Collected | 1,272 | 1,367 | 1,486 | 1,717 | 1,932 | 1,920 | 13% | 1% | 11% |
| Benefits Paid | 496 | 642 | 1,189 | 1,199 | 1,121 | 1,572 | 6% | 29% | 24% |
Member's fund statistics
| Five Year Performance Review | Actual 19/20 | Actual 20/21 | Actual 21/22 | Actual 22/23 | Actual 23/24 | Budget 23/24 | Actual 23/24 vs Actual 22/23 Var % | Actual 23/24 vs Budget 23/24 Var % | CAGR (19/20-23/24) |
|---|---|---|---|---|---|---|---|---|---|
| Interest Credited to Members** | 1,154 | 1,516 | 1,380 | 1,584 | 2,073 | 1,906 | 31% | 9% | 16% |
| Interest Declared (%) | 10.75% | 12.15% | 9.65% | 10% | 11.5% | 10.00% | 15% | 15% | N/A |
| Compliance Level (%) | 55% | 51% | 55% | 57% | 57% | 60% | 0% | -5% | N/A |
| Benefits Processing Time (Days) | 7 | 8 | 11 | 12 | 10 | 7 | -15% | 44% | N/A |
Interest Credited to members** Interest credited to members has grown by a CAGR of 16% in the past five years due to continued exceptional performance posted by the Fund. The rates declared have consistently surpassed the 10-year average inflation threshold.
Customer satisfaction rate (%)
| Five Year Performance Review | Actual 19/20 Ushs. Billion | Actual 20/21 Ushs. Billion | Actual 21/22 Ushs. Billion | Actual 22/23 Ushs. Billion | Actual 23/24 Ushs. Billion | Budget 23/24 Ushs. Billion | Actual 23/24 vs Actual 22/23 Var % | Actual 23/24 vs Budget 23/24 Var % | CAGR (19/20-23/24) |
|---|---|---|---|---|---|---|---|---|---|
| Internal Customers (Staff) | 93% | 94% | 93% | 86% | 89% | 90% | -8% | -4% | N/A |
| External Customers (Members) | 88% | 86% | 86% | 88% | 87% | 90% | 2% | -2% | N/A |


A NEW DAY - CREATING SHARED VALUE FOR SUSTAINABLE GROWTH