OUR PERFORMANCE:
CIO's Business Review


Introduction
On behalf of the NSSF investment team, I am pleased to report on the investment performance and initiatives for the reporting period ending 30 June 2024. It is a new day. The fiscal year was yet another period, marked by significant challenges, including the ongoing wars and violence in the Middle East and Ukraine, as well as continued geopolitical tensions between the US, Russia, and China. Almost all nations felt the effects of sustained global economic uncertainty and volatile markets.
Gerald Paul Kasaato, Chief Investment Officer
On a positive note, inflation in most countries has decreased from the peak seen last fiscal year, as higher policy rates and borrowing costs have helped ease price pressures globally. However, the easing of inflation towards the central banks’ targeted rates (around 2% in advanced economies, and 5% in East Africa), has been slow, leading to delays in reducing the respective policy rates. As a result, the fiscal year was marked by significant accomplishments driven by a combination of strategic asset allocation, rigorous risk management, and a commitment to sustainability practices.
Towards the end of the fiscal year—in the last weeks of June 2024, we witnessed protests in Kenya spearheaded by the Gen Z movement who were unhappy with the Finance Bill 2024 and the tax proposals therein—the effect of the market movement on the performance was more than UGX 100Bn. However, despite the combination of a challenging macroeconomic and social environment, we managed to achieve very strong returns that yet again underscore the resilience and effectiveness of our investment strategy. East Africa continues to enjoy robust growth of between 5% and 6% compared to other parts of the world (world 3.2%, Sub-Saharan Africa 3.8%) in 2024.
It is now the 9th year of the 10-year strategic plan ending 30 June 2025. The Fund continues to grow in all dimensions. By recording assets of over UGX 22Tn, we have achieved the asset goal of UGX 20Tn one year ahead of schedule—as promised last year. Reaching UGX 20Tn was accomplished against a backdrop of legislative changes—such as amendments to the NSSF Act in 2022, the Covid-19 pandemic, and heightened geopolitical tensions globally. By all accounts, this performance is remarkable. I could not have been prouder of the team that I have led for the last 10 years to 30 June 2024.
A total revenue of UGX 3.180Tn, 35% above the budget of UGX 2.349Tn, and 175% year on year from UGX 1,178Tn, was impressive. We manage the Fund’s investments to maximise long-term returns within the guidelines of the Investment Policy Statement (IPS) using strategies like; market exposure, security selection, and timing across various asset classes. These strategies are complementary and aim to take advantage of the Fund’s size and long investment horizon. Each strategy has evolved over time. The contributions to the relative return from all the asset classes show that fixed income continues to contribute most to the Fund’s return.
Under the market exposure strategy, the Fund is broadly invested in equities and bonds, following the guidelines in the IPS. Investments are made cost-effectively with the goal of achieving the highest possible return. The security selection strategy relies on fundamental analysis of companies and bonds, using in-house expertise developed over time. The allocation strategy also includes investments in real estate and unlisted equities.
Robust performance despite a challenging economic environment and volatile markets
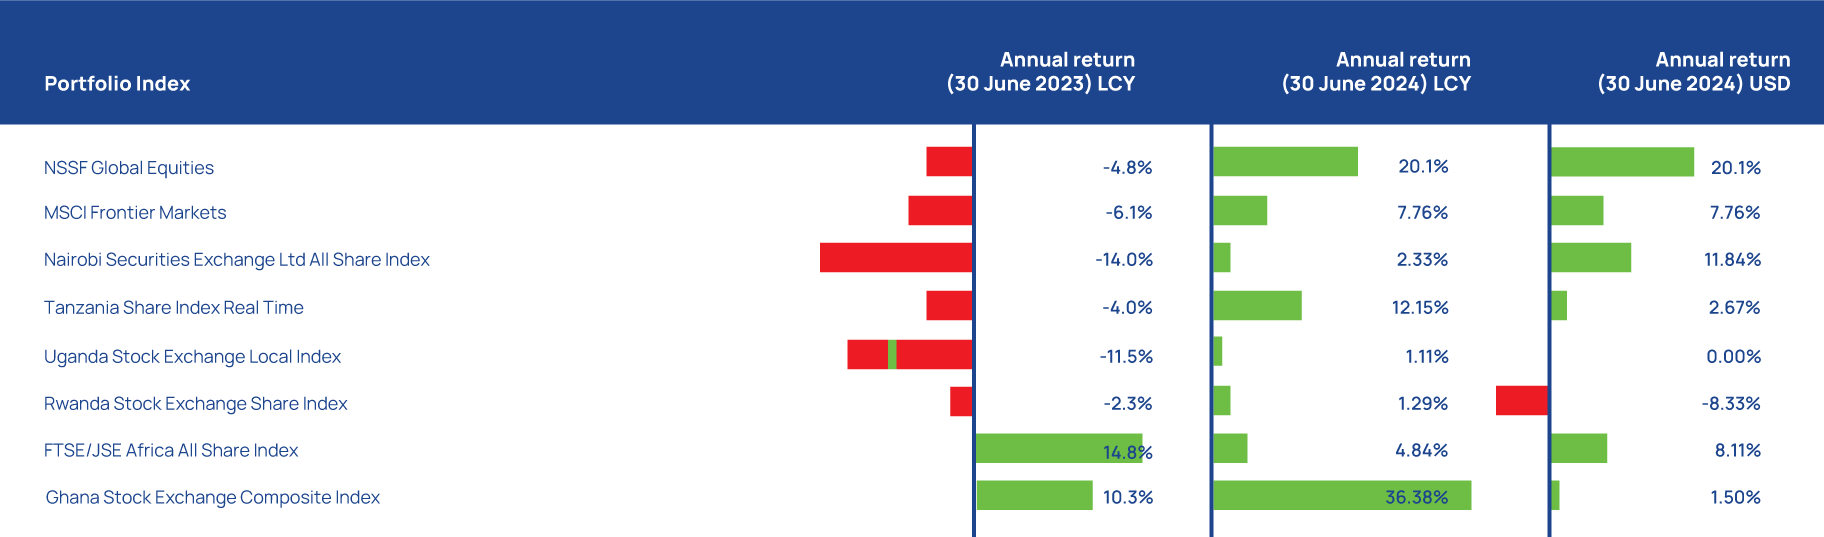
A total portfolio return performance of 17.10% (compared to 11.93%last year) in the prevailing macroeconomic economic and social conditions is remarkable. The 12-month returns were led by fixed income investments at 17.61%, equity returns came in at 20.07%, and real estate investments delivered 5.56%. The equity returns performance as of 30 June 2024, compared to other African markets (excluding South Africa) and frontier market benchmarks is depicted in Figure 1:
Figure 1: How the Fund’s equity returns compare with different markets over the one year to 30 June 2024
The year-on-year performance of the equity markets as of 30 June 2024, highlights the effectiveness of the Fund`s investment strategy, of which diversification is key. The regional equity markets` perfomance in the year was bullish (compared to last year), thereby driving the overall equity portfolio return performance to 20.07% (compared to a negative 4.8% in 2023). In relative terms to the markets shown in Fig.1 above, this was impressive. The portfolio continues to benefit from robust stock selection and country weighting. The portfolio also benefited from a tactical addition of MTN and Airtel stocks which are listed on the Uganda Securities Exchange—two value stocks.
The Nairobi Stock Exchange (NSE) saw a significant capital inflow after two consecutive years of net outflows due to capital flight, driven by Kenya's improved macroeconomic conditions around currency and debt. The year-on-year performance of the NSE All Share Index was 2.33% in KES, but when converted to USD, it rose to 11.84%, making the NSE the best-performing African market in hard currency(USD) terms. Meanwhile, the Uganda Securities Local Index grew by 1.11%, and the Tanzanian market saw a recovery with a 12.15% increase, compared to last year's negative 4.0%.
 Source: Bloomberg
 Emphasis on long-term sustainability
It is important to note that, while the strong gross positive returns are encouraging in this period of uncertainty, our focus remains on the long-term sustainability of the Fund`s investment programme. Capital markets are naturally subject to volatility in the short-term, which is why we prioritise long-term performance. The Fund invests for decades to match its liability profile, not just for a single year. To this end, one-year returns of 17.10% are just part of the results picture for a retirement savings scheme like NSSF. Even returns over 3 years (13.50%), 5 years (14.04%) and 7 years (14.60%)— annualised returns, as shown in Table 1 below, represent relatively short to intermediate time frames for measuring results.
It is the 10-year (14.66%) and 15-year (14.05%) returns that truly reflect the Fund's ability to sustainably provide retirement benefits. The returns achieved for the year ending 30 June 2024, in a challenging regional and global environment, affirm the sustainability and strength of the investment strategy.

Table 1: A review of the historical return performance of the Fund over the last 15 years
| Periods through 30/06/2024 | The Fund`s Investment | Average 10-year/Annualised Average inflation | Average 10-year inflation + 200 basis points | Interest declared to: |
|---|---|---|---|---|
| Total/Annualised Average return | Members | |||
| 1 Year | 17.10% | 3.99% | 5.99% | 11.50% |
| 3 Years | 13.50% | 4.03% | 6.03% | 10.29% |
| 5 Years | 14.04% | 4.63% | 6.63% | 10.72% |
| 7 Years | 14.60% | 5.22% | 7.22% | 11.37% |
| 10 Years | 14.66% | 6.00% | 8.00% | 11.53% |
| 15 Years | 14.05% | 6.52% | 8.52% | 10.74% |
| 3-Years after 2008 | 10.40% | 7.01% | 9.01% | 7.67% |
Source: Internal

Downsides and trade-offs
The downsides and trade-offs included benefits payouts, the appreciation of the Uganda Shilling, low compliance, and continued slow progress on projects. The robust performance for the fiscal year is better understood in the context of these challenges.
At the beginning of the fiscal year (July 2023) our economic outlook for the region, particularly Kenya, was more pessimistic than what ultimately transpired by the end of the year.
As a result, to some extent , our portfolio was positioned more conservatively which limited our gains from the equity market recovery.
For example, the Bamburi stock on the NSE achieved a total return of 81.93% (or 83.14 % annualised) between 3 July 2023 and 30 June 2024,according to Bloomberg data.
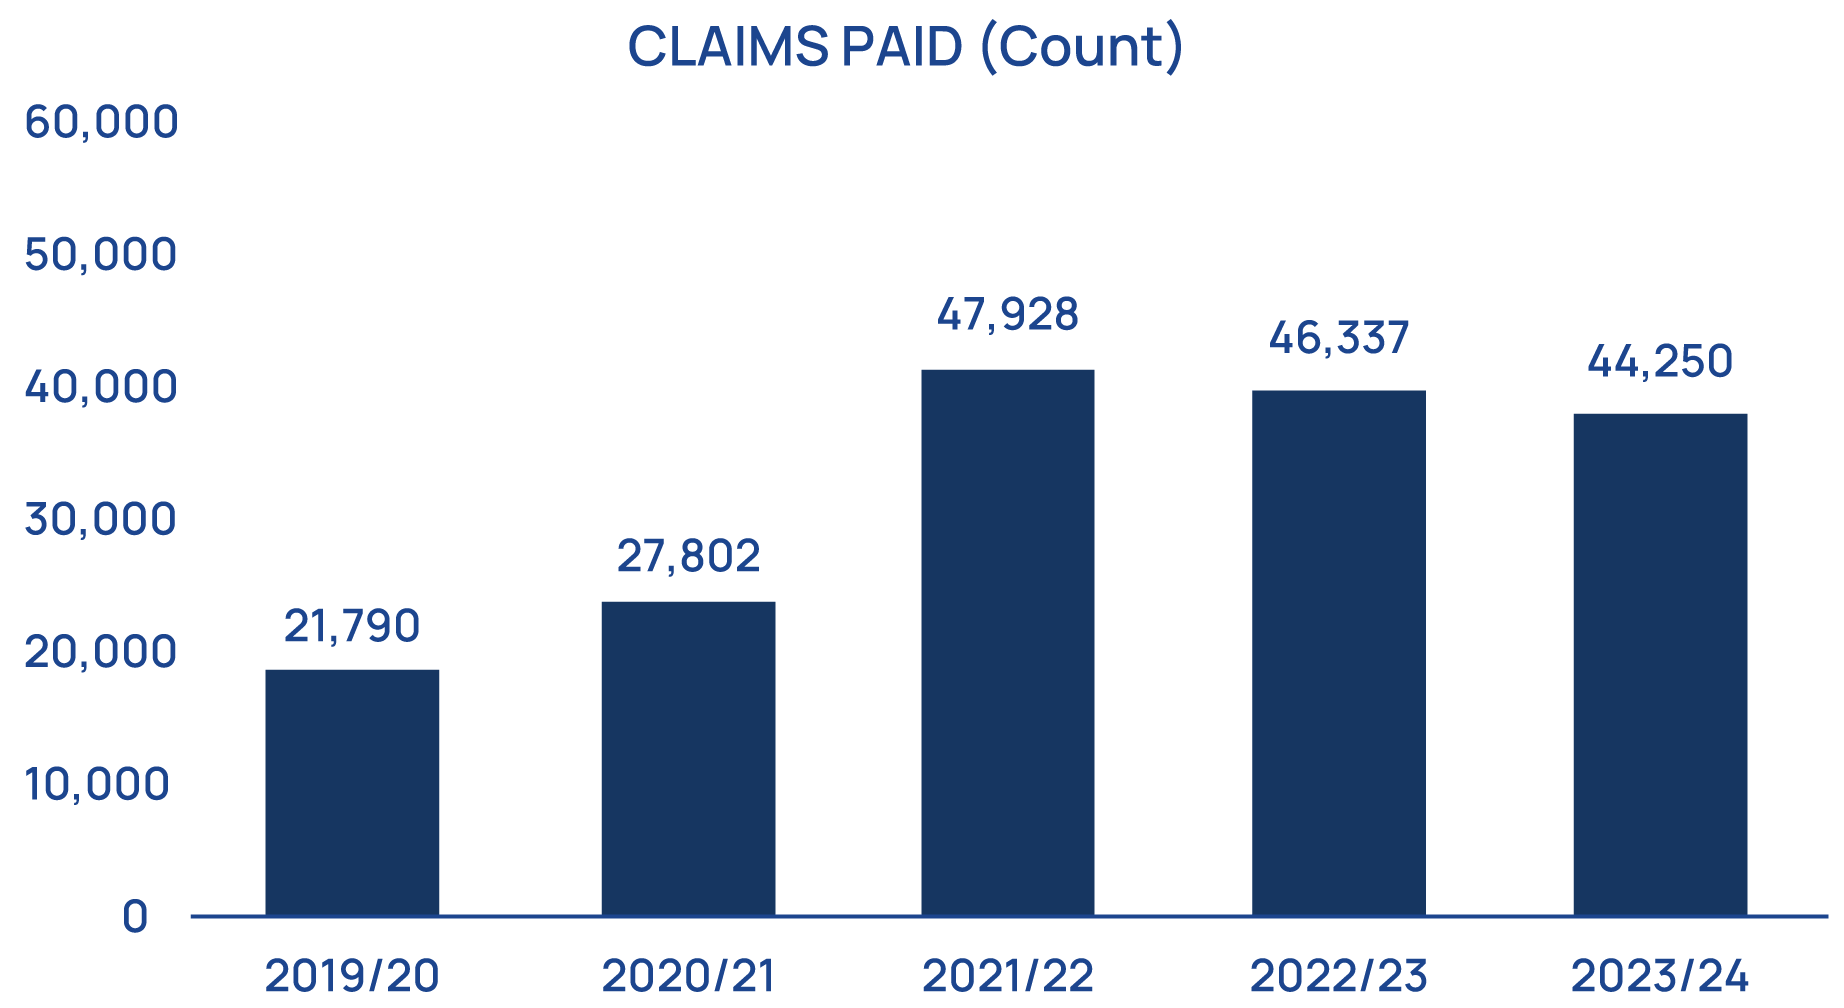
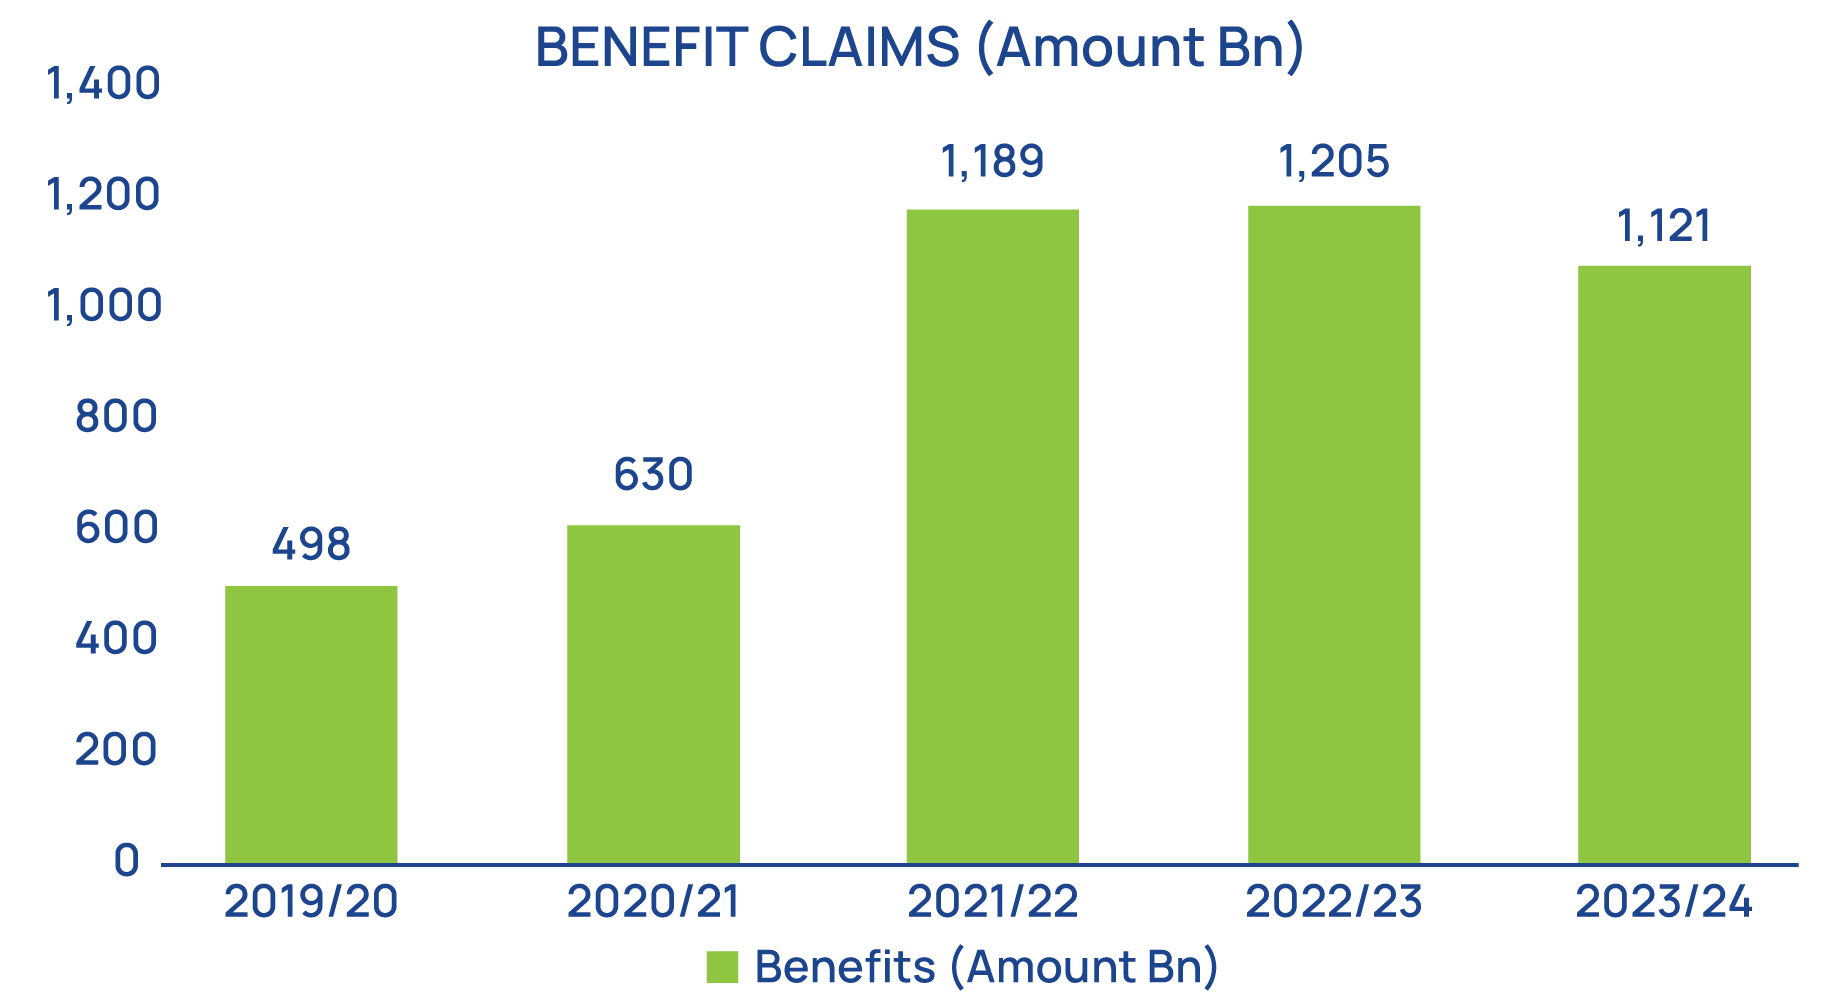
Benefits pay-outs remain elevated
The NSSF Act Cap 230, provides for mid-term access to members’ benefits who meet the qualifying criteria. This required immediate liquidity/cash to fund the pay-outs.
As seen in Figure 2, benefits pay trajectory continues to be elevated (although there was a reduction in the year of about 7%).
The effect is a drag on investment performance, with a sustained heightened focus on treasury and cash flow management.
Figure 2: Benefit payments (count and amount)
Source: Internal
Macro environment and strengthening of the Uganda Shilling
Figure 3: Uganda Shillings against regional currencies over the one year to 30 June 2024
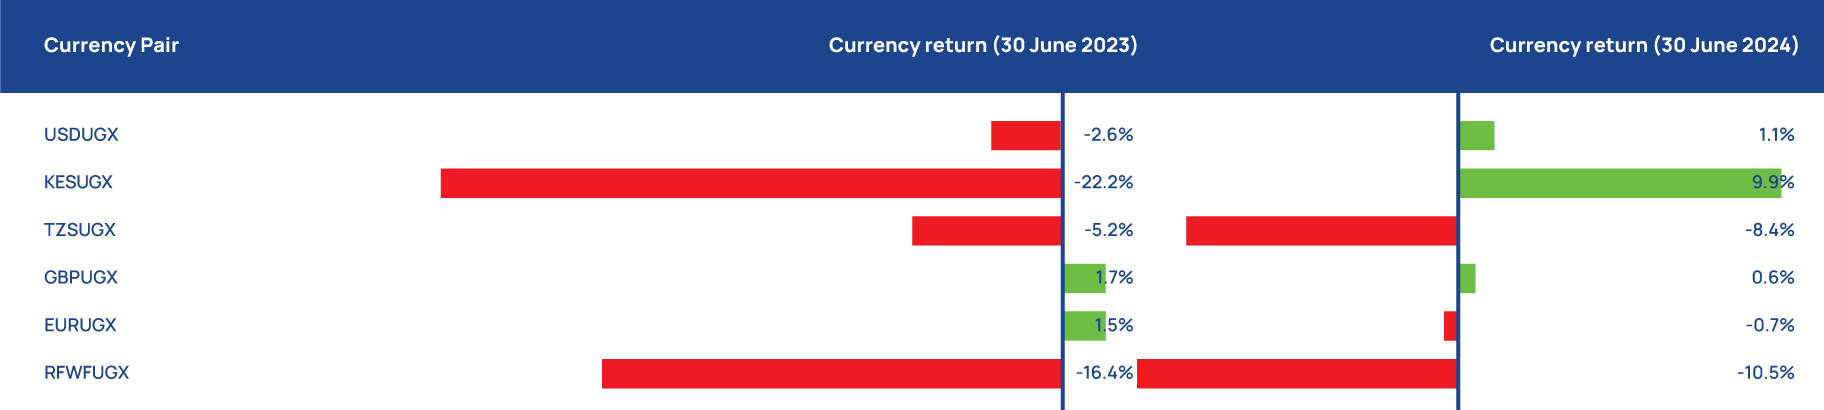
Regional investments are assets denominated in currencies other than the Uganda Shilling (UGX). The total return on these assets is a function of exchange rate movements between the UGX and the regional currencies (Kenya Shillings, KES, Tanzania Shilling, TZS and Rwandese Franc, RWF). For example, the UGX return on the Fund’s KES bonds or equities is affected by the KES return on the bonds or equities as well as movements in the exchange rate between the UGX and the KES. In the financial performance, we consider returns in UGX terms. The UGX return also determines the regional portfolio’s contribution to the interest rate declared to members. Put simply, R_UGX ≈ R_RC + R_FX, where R_RC is the KES or TZS return on the regional asset and R_FX is the movement in the exchange rate. Movements in exchange rates (R_FX) represent a sizeable portion of the regional portfolio’s risk and return. The Fund’s investment strategy views currency risk as a potential source of incremental return, and the fiscal year ended 2024 demonstrated this. Essentially, a weaker UGX against the foreign currencies in which the Fund is invested increases the market value when measured in UGX.
From June 2011 to June 2024, all East African currencies have depreciated against the USD. Over the period, the UGX, KES, and TZS moved by 44.6%, 44.7%and 63.9% respectively against the USD. This represents an average annual depreciation over the period of 3.1%, 3.1%, and 3.9%, respectively (see investment beliefs later). However, during the fiscal year to 30 June 2024, the UGX continued to appreciate against regional peers (or regional currencies depreciated against the UGX) except for the KES. Figure 3 below shows that when paired against the KES, the second major portfolio currency, the UGX depreciated (or the KES appreciated against the UGX) by 9.9% in the year. The UGX appreciated by 10.5%against the Rwandese Franc. Moreover, the UGX appreciated by 8.4% against Tanzania Shilling. The net effect was UGX 255Bn in currency gains.

A NEW DAY - CREATING SHARED VALUE FOR SUSTAINABLE GROWTH