OUR PERFORMANCE:
CIO's Business Review

Investment performance explained
During the year, we reviewed our strategic asset allocation (SAA). Upon evaluation and analysis, we elected to maintain the optimal weight targets to 75%, 17.5% and 7.5% for fixed income, equities, and real estate, respectively.
This suggests an overall modest risk profile. The asset mix as of 30 June 2024, is depicted in Table 4 below:
Table 4: The Fund`s asset mix as of 30 June 2024
| No. | Asset Class | Allocation | Performance | Weighted Performance | Sharpe Ratio |
|---|---|---|---|---|---|
| (1) | Equities | 13.32% | 20.07% | 2.67% | 1.44 |
| (2) | Real Estate | 6.94% | 5.56% | 0.39% | 0.09 |
| (3) | Fixed Income | 79.74% | 17.61% | 14.04% | 60.22 |
| 100.00% | 43.24% | 17.10% | 6.24 |
Source: Internal
The asset mix trend over the last twelve years is depicted in Figure 5 below:
Figure 5: The Fund’s asset mix trend for the last thirteen years
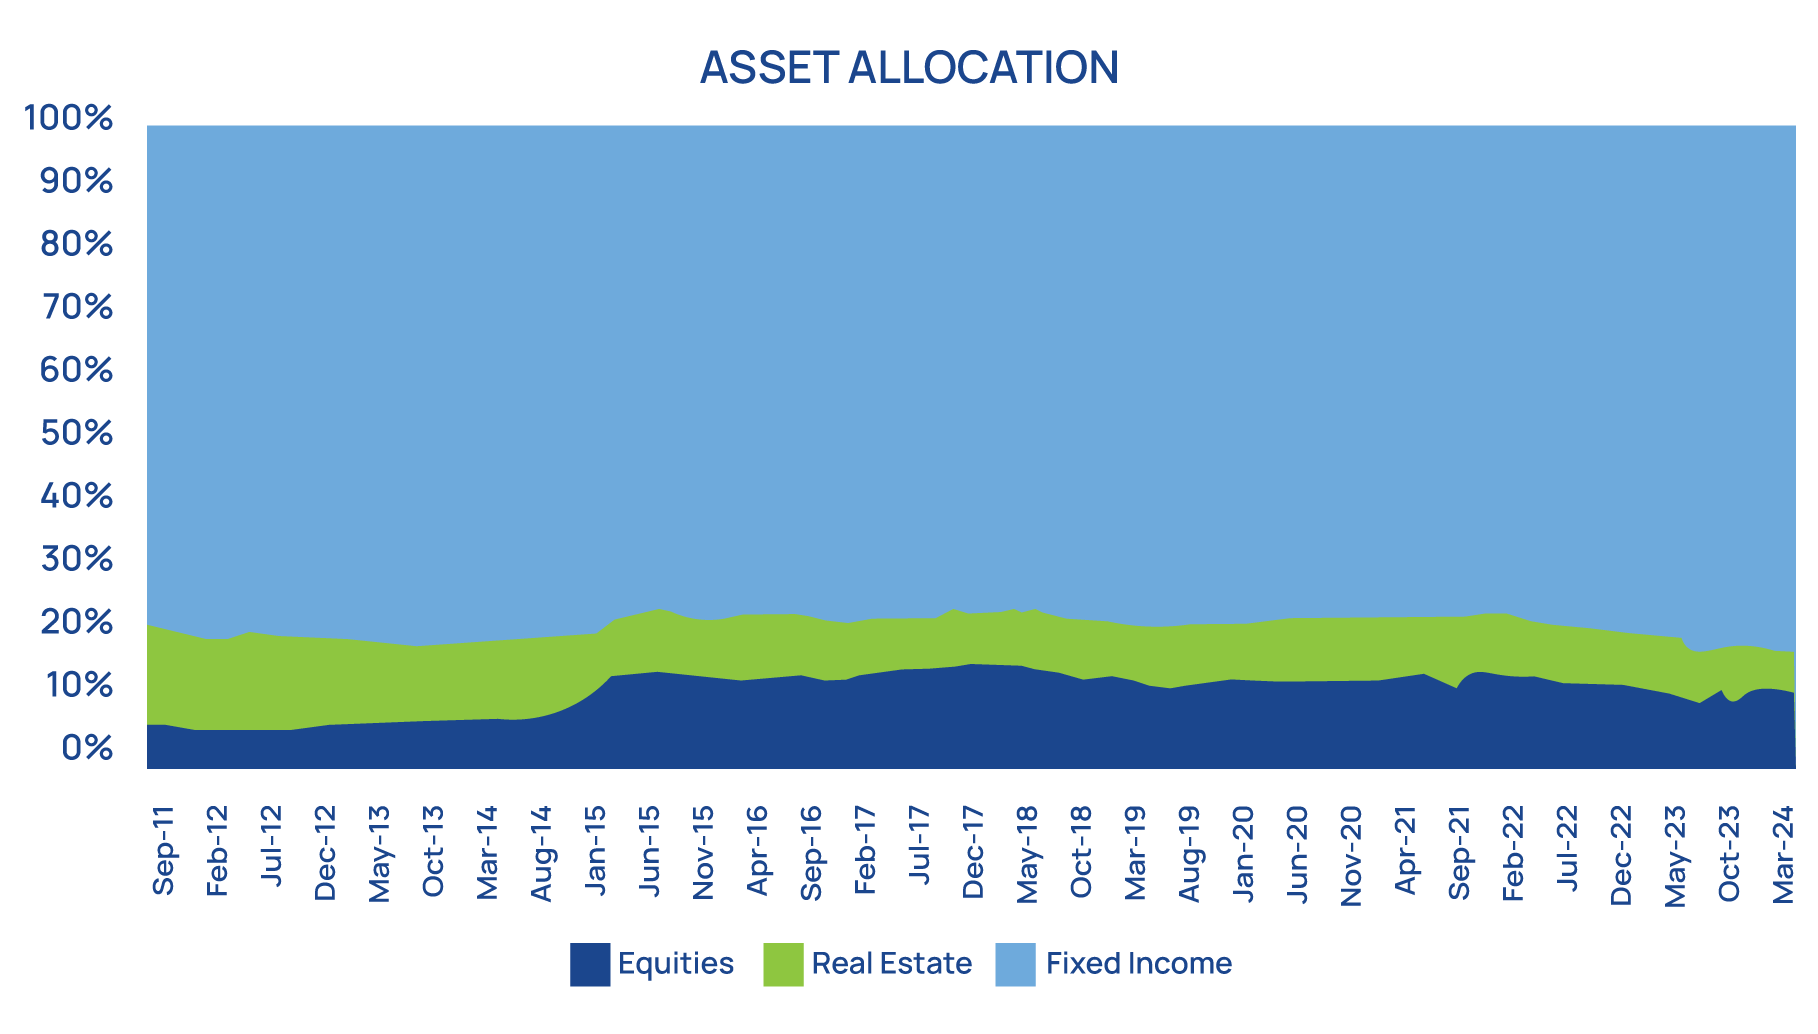
Essentially, the investment mix is predominantly skewed towards fixed income. There have been deliberate efforts to diversify the investment portfolio since 2011. This has resulted in more allocation to equities and a reduction in real estate allocation over the years. This is mainly attributed to the slow absorption of funds into projects caused by a rather bureaucratic process of procurement and contract management.
Moreover, the growth in the asset size of the Fund has not been consistent with the opportunities on the stock markets. Even the significant investments in MTN (secondary listing) and Airtel (IPO) with over UGX 300 billion invested in the fiscal year did not necessarily cause a dent in the allocation. Most listed companies are either small or have free floats that are less than 50%--with several at 20%. Yet the few blue chips present a concentration risk.
Source: Internal
Nonetheless, we believe that, in the circumstances, having a moderate risk profile for the asset allocation for the Fund is reasonable for several reasons:
The investment portfolio is mainly exposed to six risk factors as depicted below. The exposure to these risk factors has largely stayed the same if you observe the periods of 30 June 2022, to 30 June 2024.

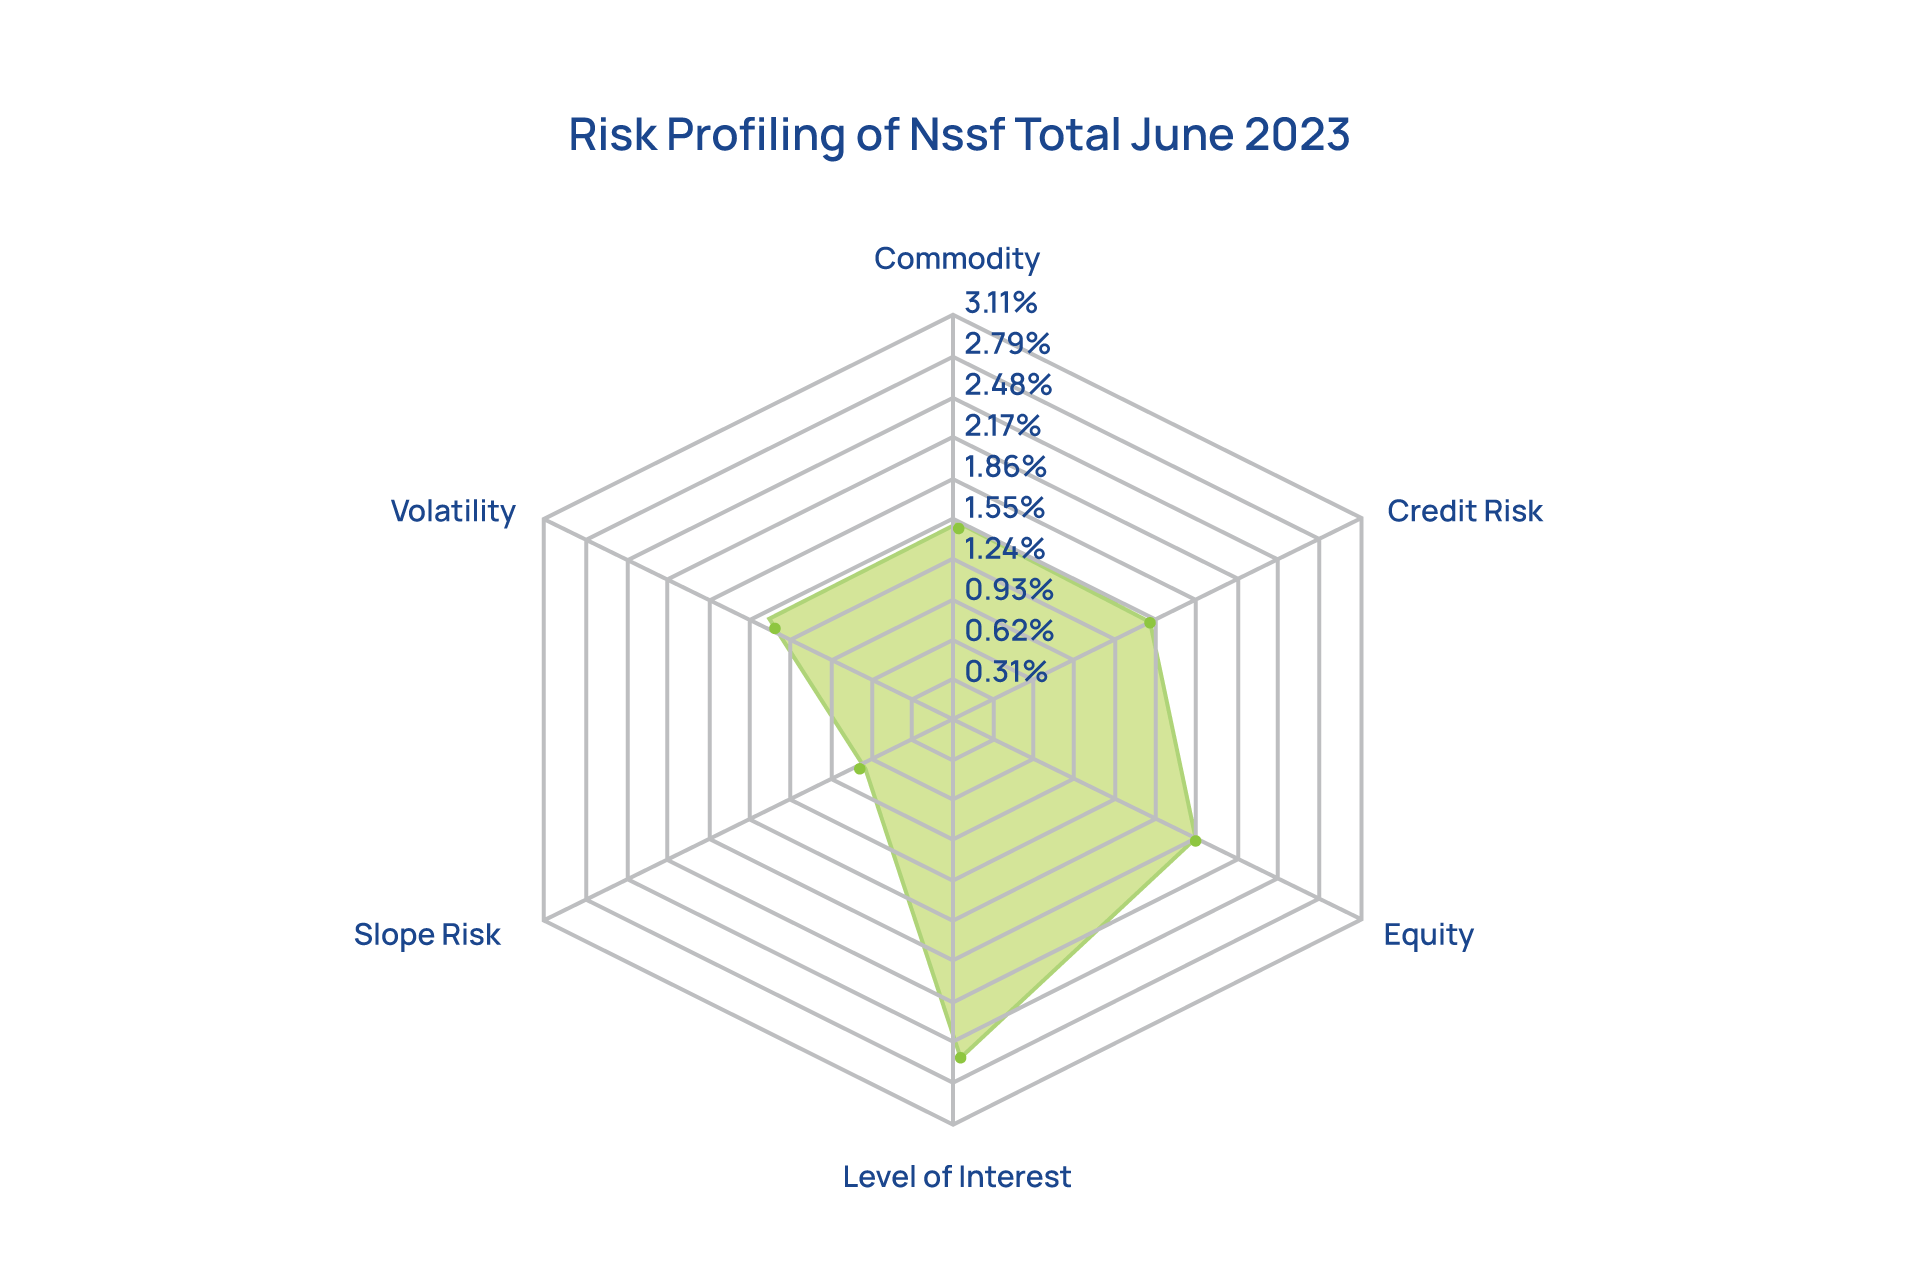
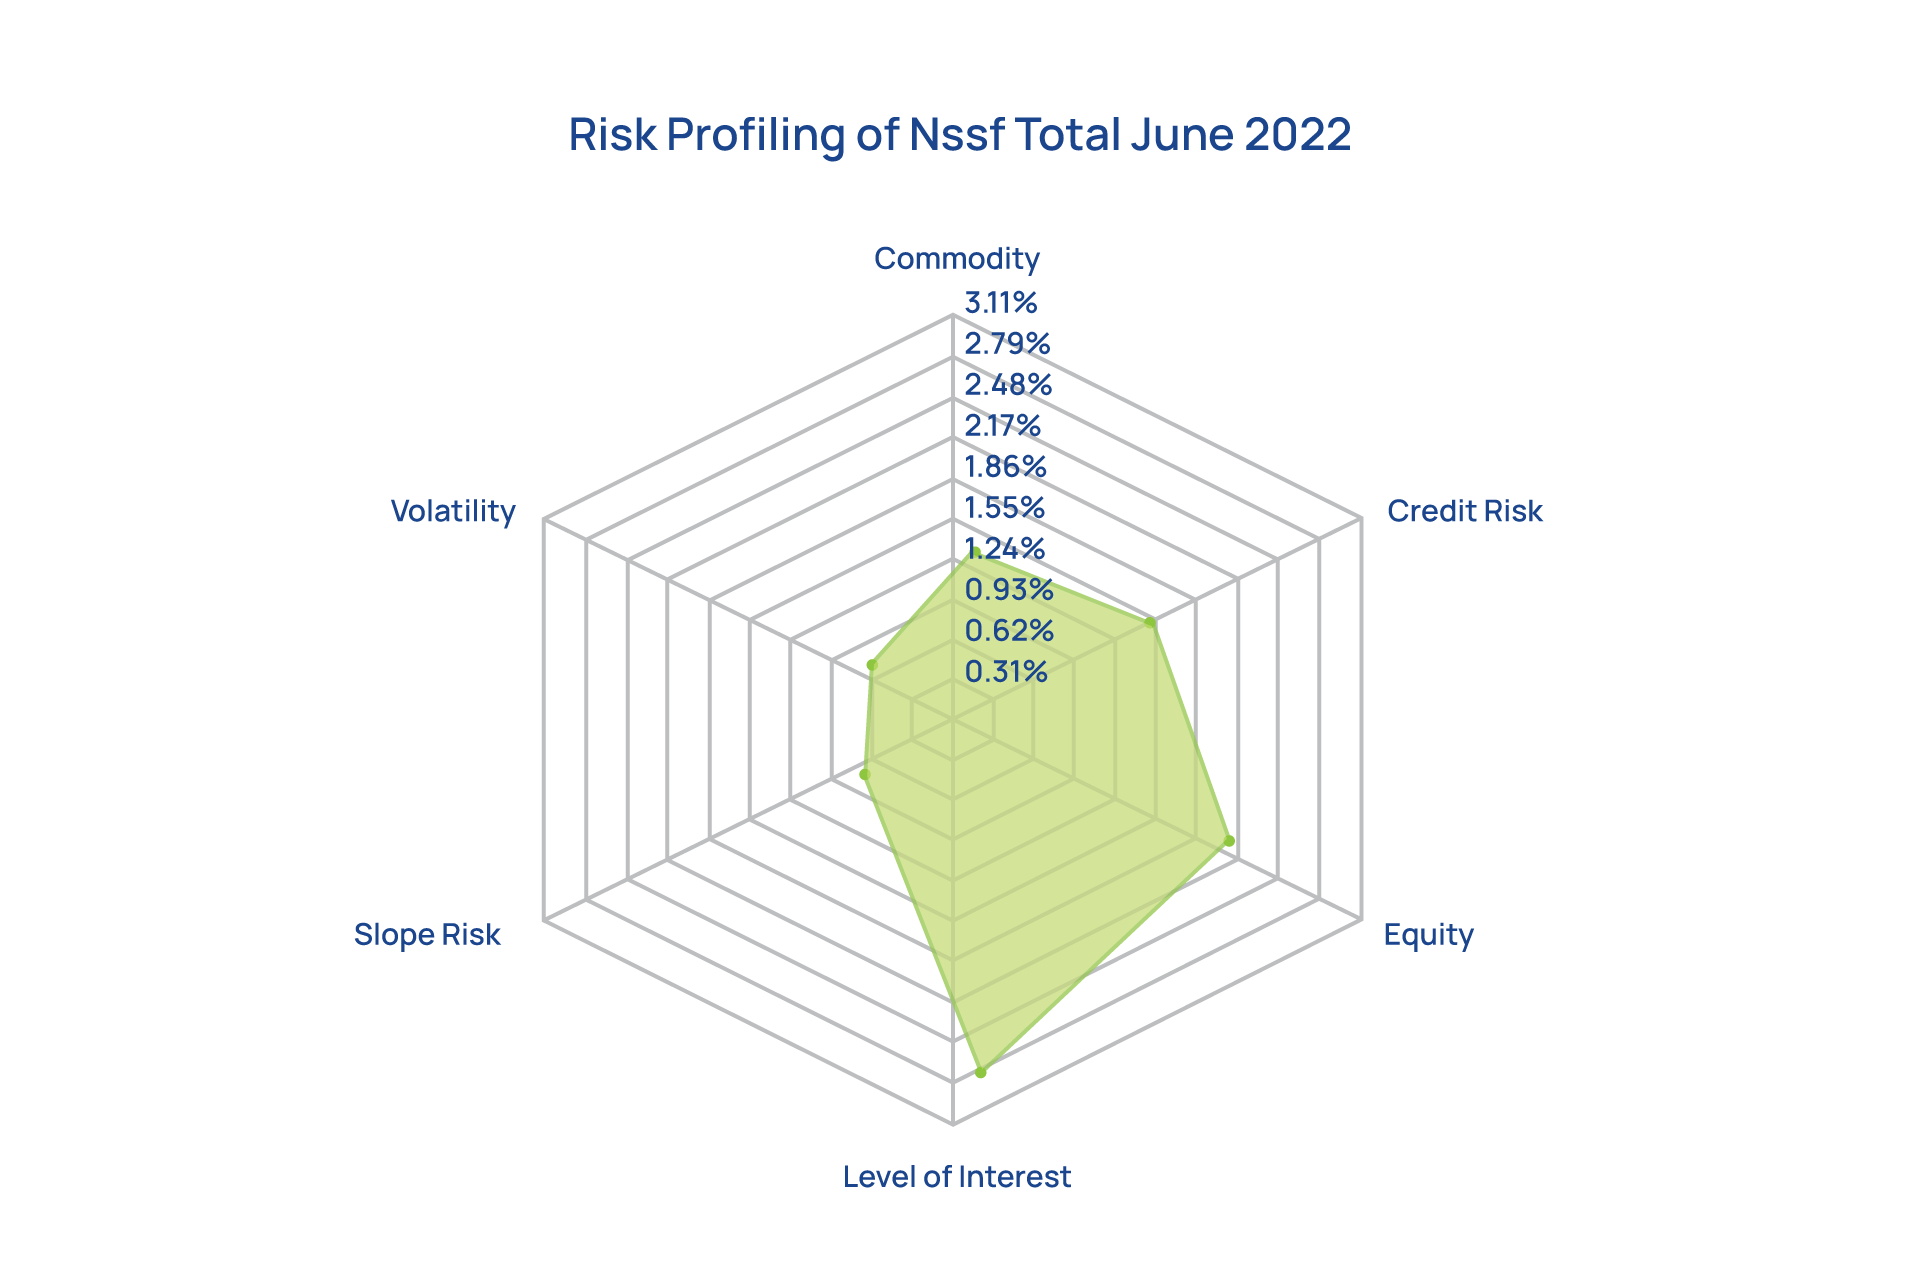
Figure 6: The Fund’s investment portfolio broad risk factors
The overall risk of the portfolio on 30 June 2024, was lower compared to what it was on 30 June 2022.
Nevertheless, the biggest exposure of the portfolio is the level of interest rates. This is consistent with the large allocation to fixed income and investments in interest rate-sensitive stocks like financial services companies, mainly banks. The other key risk factors are market volatility, company-specific factors, and credit risk.
Equities explain most of the volatility of the portfolio occasioned by the change in prices on the stock exchanges. Uganda being a frontier market also explains the existence of commodity and credit risk as key risk factors for the portfolio.
Source: Internal
Diversification efforts
The fixed income portfolio stood at 79.74%of total assets while the equity and real estate portfolios stood at 13.32%and 6.94%respectively. Compared to one year ago, the allocations to fixed income largely remained flat, while equities have increased with the recovery of the stock market and addition of MTN and Airtel to the portfolio.
These allocations are consistent with the Fund’s preferred strategic exposures as per the SAA limits in Table 5 below.
Table 5: Asset class allocation
| Asset Class | Jun-22 | Sep-22 | Dec-22 | Mar-23 | Jun-23 | Sep-23 | Dec-23 | Mar-24 | Jun-24 | SAA |
|---|---|---|---|---|---|---|---|---|---|---|
| Fixed Income | 77.62% | 78.41% | 78.46% | 79.14% | 78.48% | 80.31% | 78.77% | 79.11% | 79.74% | 75.00% |
| Equity | 14.82% | 14.13% | 13.88% | 13.26% | 12.51% | 11.85% | 13.52% | 13.84% | 13.32% | 17.50% |
| Real Estate | 7.56% | 7.46% | 7.67% | 7.60% | 9.01% | 7.84% | 7.71% | 7.06% | 6.94% | 7.50% |
| Total | 100.0% | 100.0% | 100.0% | 100.0% | 100.0% | 100.0% | 100.0% | 100.0% | 100.0% | 100.0% |
Source: Internal
Fixed income
We continued to take advantage of opportunities in the fixed income markets in both Uganda and the region, albeit in a constrained way. The fixed income asset class recorded a return of 17.61%, an increase from 10.45%recorded the previous year. Table 6 below illustrates the movement in the regional yield curves.
These allocations are consistent with the Fund’s preferred strategic exposures as per the SAA limits in Table 6 below.
Table 6: Regional yield curves movements
| Tenor | Uganda | Kenya | Tanzania | ||||||
|---|---|---|---|---|---|---|---|---|---|
| Jun-24 | Jun-23 | Change | Jun-24 | Jun-23 | Change | Jun-24 | Jun-23 | Change | |
| 91 days | 10.08 | 9.34 | 0.08 | 16.06 | 11.90 | 0.35 | 8.07 | 3.96 | 1.04 |
| 182 days | 12.38 | 10.73 | 0.15 | 16.61 | 11.95 | 0.39 | 6.57 | 5.80 | 0.13 |
| 364 days | 13.39 | 11.78 | 0.14 | 16.90 | 12.16 | 0.39 | 6.75 | 7.14 | -0.05 |
| 2 years | 13.62 | 12.29 | 0.11 | 17.30 | 13.76 | 0.26 | 11.64 | 9.13 | 0.28 |
| 5 years | 15.23 | 14.26 | 0.07 | 15.39 | 14.36 | 0.07 | 10.09 | 9.85 | 0.02 |
| 7 years | 15.75 | 14.53 | 0.08 | 14.98 | 14.58 | 0.03 | 9.71 | 9.71 | 0.00 |
| 10 years | 16.02 | 14.79 | 0.08 | 14.98 | 14.77 | 0.01 | 12.30 | 11.22 | 0.10 |
| 15 years | 16.12 | 15.29 | 0.05 | 14.97 | 14.76 | 0.01 | 15.16 | 11.96 | 0.27 |
| 20 years | 16.73 | 15.31 | 0.09 | 15.45 | 14.61 | 0.06 | 15.13 | 13.08 | 0.16 |
| 25 years | - | - | - | 16.00 | 15.05 | 0.06 | 15.38 | 13.60 | 0.13 |
Source: Internal

In Kenya, we observed an upward shift in short-term yields, creating favourable opportunities in the second half of the year after a cautious approach in the first half. Yields in Uganda also improved year-over-year.
In Tanzania, yields increased at the long end of the curve following the Bank of Tanzania’s decision to reopen high-coupon rate bonds in February 2024. The Fund primarily invests in the long end of the yield curve to match the duration of its member fund.
As a result, we secured attractive yields at this segment, which will provide substantial interest income in the years ahead.

A NEW DAY - CREATING SHARED VALUE FOR SUSTAINABLE GROWTH